Here are some definitions to help you in your investigation.
Mass - the amount of matter in something. Usually measured in grams (g).
Volume - the amount of space something takes up. Usually measured in centimeters cubed (cm3).
Density - the compactness of a material. Water density is calculated by dividing its mass by its volume.
g/cm3 - a unit used to measure density. (grams/cubic centimeter)
Temperature - a measure of the hotness or coldness of something
Celsius (ºC) - a unit for measuring temperature. Room temperature is about 25 ºC.
Force - any push or pull on something. Usually measured in newtons (N).
Area - a specific part of a surface. Usually measured in meters squared (m2).
Pressure - a measure of the force over a given area
Newtons/meter2 - a unit used to measure pressure
Distance - a measure of the length of something
Meters - a unit of measure of depth. One meter is about 3 feet.
Depth - the distance from the top or surface of something to the bottom of something
Trench - a very low point in the bottom of the ocean
Prediction - a statement about a future event, often based on experience
Water density – the mass of water divided by the volume of water. This quantity is measured in units of grams per cubic centimeter (g/cm3).
Temperature – a measure of the hotness or coldness of the water. This quantity is measured in units of degrees Celsius (oC).
Pressure – the amount of force of the water per unit area. This quantity is measured in units of newtons/square centimeter (N/cm2).
Salinity – the amount of salt dissolved in water. This quantity is measured in units of practical salinity units (psu).
Prediction Error - how far a predicted measurement is from the true or actual measurement
Reading and Interpreting a Line Graph
What is a Line Graph?
A line graph is a tool that provides a picture using a line or lines to show how things change over time or how they're connected. For instance, you want to see how a plant grows over time. So you measure the plant's height every week. You can use a line graph to see how the plant is growing!
Reading and Interpreting the Graph (See Figure 1.)
• Seeing Changes: Look at the line. If it goes up, the plant is growing! If it stays flat, it's not changing its height, and if the line goes down, the plant is losing height.
• Comparing Weeks: You can easily see which weeks the plant grew the most by looking for the steepest parts of the line.
Finding the Height (See Figure 2.)
• To find the plant height at a certain week, find that Week Number on the bottom line (x-axis), go straight up to the line, and then look across to the Plant Height number on the side (y-axis). On this graph, the plant at week 6 had a height of 9 centimeters.
Extrapolating the Data Beyond the Line (See Figure 3.)
• Following the Trend: If the line is going up or down steadily, you can predict that the plant will continue changing its height at about the same rate in the next few weeks.
• Making a Prediction: You can extend the line a little bit past your last data point (see the dashed line) to make a prediction about the plant's height in the future. But remember, it's just a prediction! Things might change.
Using our extended line in this graph, we predict the plant will have a height of 7 centimeters at week 11.
• Limitations: Extrapolating too far out is not always accurate. The plant could stop growing, or grow at a different rate.
)
What is pressure?
Pressure is defined as the force per unit area. For a given area, pressure increases with increasing force. For a given force, pressure decreases with increasing area. For example, a 5-pound book resting on a person's arm would not be too painful or cause much damage; however, if the same book was placed on the arm with a needle between the book and the arm, the increase in pressure due to the reduction in area would cause the person much pain.
What is density?
Density can be thought of as the compactness of a material. The more compact the material, the higher the material's density. Density is defined as the mass of an object divided by its volume. Common units of density are grams per milliliter or grams per cubic centimeter.
What is salinity?
Salinity refers to the amount of salt, primarily sodium chloride or table salt, in water. Fresh water typically has salinity around 0.05%, while ocean water's average salinity is about 3.5%; the higher the percentage value, the more salt is dissolved in the water.
What are the layers of the ocean?
Ocean water is divided into four different layers depending on the depth and amount of sunlight reaching the layer. The uppermost layer at the surface of the ocean is called the Epipelagic zone or the sunlight zone, and extends down to a depth of around 200 meters. The next layer down is called the Mesopelagic zone or twilight zone with a depth from 200 - 1,000 meters. The Bathypelagic zone, also called the midnight zone, extends from 1,000 to 4,000 meters. The deepest zone, called the Abyssopelagic zone, goes from 4,000 to a depth of 6,000 meters.
How does pressure vary with ocean depth?
In a fluid, the pressure increases with increasing depth. The equation that is used to calculate the pressure at a given depth is: pressure equals fluid density times acceleration due to gravity times the depth of the fluid. The pressure in a fluid also acts equally in all directions at a given depth. This means that a diver lying flat at a given depth has the same amount of pressure acting down on his back as pushes on his nose or on his belly.
How does temperature vary with ocean depth?
The temperature of ocean water varies with depth. Since sunlight is the primary heating source, depths that receive little sunlight would be expected to be the coldest regions of the ocean. Ocean water temperature decreases gradually in the Epipelagic zone, then falls off sharply in the Mesopelagic zone, and remains a fairly constant 4 °C in depths below that zone.
How does water density vary with ocean depth?
The density of ocean water at the surface averages about 1.025 g/mL. From the surface to around a depth of 1,000 meters, the density of the ocean water increases steadily to about 1.028 g/mL. Beyond this depth, the density of the water remains fairly constant at this same value.
How does salinity vary with ocean depth?
Ocean surface water generally has the highest salt concentration (about 3.50%) of any depth. From the surface to a depth around 600 meters, the salinity decreases steadily to about 3.40%. The water's salinity then increases very slightly and remains fairly constant at 3.45% all of the way to the deepest trenches.
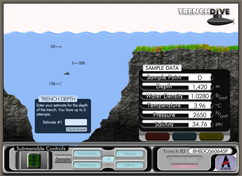 Some parts of the greatest ocean depths, the Marianas Trench, are around 11,000 meters deep. This means that the top of the tallest mountain on Earth, Mount Everest, if placed in the trench would be over 2,000 meters below the surface of the ocean. Scientists send submersibles to these great depths to determine characteristics of the seawater and life that exists there. Your challenge is to determine the depth of this ocean trench after your depth gauge breaks. Are you ready to go deep on this watery adventure?