What is quality control?
Quality control is a process designed to find and reduce analytic errors to improve the accuracy and precision of patient laboratory test results. Special samples that are placed in the testing process and run alongside patient samples using identical operating conditions are called quality control samples. These control samples placed in the analytical runs help evaluate the reliability of the testing methods.
What is the difference between accuracy and precision?
Accuracy is defined as the closeness of a value in a data set to the actual or accepted value. Precision is how close the values in a data set are together, which is usually compare to the values’ “distance” from the mean. Error is a measure of accuracy, while deviation is a measure of precision.
What is the difference between validity and reliability?
Validity is related to accuracy, that is, how close is a measure to the expected measure. Reliability is related to precision. Reliability refers to determining if the measures in a data set are consistent.
What is the difference between an assayed and unassayed chemical control?
Chemical controls sold by commercial companies generally come in two types: assayed or unassayed. Assayed controls are more expensive than unassayed controls because the accuracy and precision of the assayed controls are known. The control manufacturer does not provide assigned analyte values for unassayed controls, so these values must first be determined by the laboratory working with the controls.
What is the mean?
The mean is another name for the average, which is the sum of the values in a data set divided by the number of values in the data set.
What is the mode?
The mode is the most frequent value in a data set.
What is the median?
The median is the middle value in a data set. The values in the data set are placed in ascending or descending order, and the middle value is the median. If the data set has an even number of values, the median is the average of the two middle values.
What is the range?
The range is the difference between the largest value in a data set and the smallest value in the data set.
What is standard deviation?
The standard deviation (SD) is defined as the amount of variance in the data in a set of values. A small SD would indicate a small dispersion of the data from the mean, while a large SD represents a large spread of the data from the mean. The equation for finding SD is given by:
What is the coefficient of variation?
The coefficient of variation (CV) is often expressed as a percentage of the ratio of the standard deviation and the mean. The CV is used in clinical chemistry applications to express the precision of an assay. The equation for finding the CV is given by:
CV = (standard deviation/mean) x 100%
What is a Gaussian distribution?
A Gaussian distribution (also called a normal distribution) is a common statistical tool that graphically displays a continuous probability distribution. The image bellows shows a normal curve.
The “0” mark on the graph indicates the value of the mean, median, and mode. The +/- 1 values indicate one standard deviation above and below the mean, while the +/-2 indicates two standard deviations above and below the mean.
What is a Levey-Jennings Chart?
One of the most important quality control tools is the Levey-Jennings chart, which is a graph that shows the efficacy of a given laboratory test. The x-axis of the graph presents the date, time, or the number of the control run. The y-axis shows the mean and standard deviations (1-3). A plotted point on the graph indicates the distance the actual value was from the expected value, which in this case is the mean. The image below shows a typical Levey-Jennings chart.
The gray line in the chart indicates the mean, the purple lines +/- 1 SD, the yellow lines +/- 2 SD, and the green lines +/- 3 SD. For most clinical chemistry quality control analyses, the targeted range of acceptable results is within two (2) standard deviations.
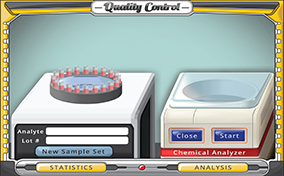 Researchers estimate that medical mistakes result in over 250,000 deaths each year in the United States. In fact, medical mistakes are now the third leading cause of death in the country. The data shows that accurate and precise laboratory testing is now more important than ever. Quality control is at the heart of valid and reliable tests. Do you have all the qualities needed to conduct laboratory tests? If so, get started with this simulation.
)
) The “0” mark on the graph indicates the value of the mean, median, and mode. The +/- 1 values indicate one standard deviation above and below the mean, while the +/-2 indicates two standard deviations above and below the mean.
The “0” mark on the graph indicates the value of the mean, median, and mode. The +/- 1 values indicate one standard deviation above and below the mean, while the +/-2 indicates two standard deviations above and below the mean.) The gray line in the chart indicates the mean, the purple lines +/- 1 SD, the yellow lines +/- 2 SD, and the green lines +/- 3 SD. For most clinical chemistry quality control analyses, the targeted range of acceptable results is within two (2) standard deviations.
The gray line in the chart indicates the mean, the purple lines +/- 1 SD, the yellow lines +/- 2 SD, and the green lines +/- 3 SD. For most clinical chemistry quality control analyses, the targeted range of acceptable results is within two (2) standard deviations.