Here are some definitions to help you in your investigation.
Matter - anything that has mass and takes up space
Mass - the amount of matter in something
Volume - the amount of space something takes up
Density - the compactness of something
Observation - the use of one of the senses to collect information about something
Senses - sight, hearing, smell, touch, and taste
Inference - a conclusion based on evidence
Estimate - to form an opinion about something’s size
Hexagonal - a shape with six sides
Triangular - a shape with three sides
Square - a shape with four side
Trials - the number of times a given experiment is repeated
Data - information collected for studying
Claim - a statement based on observations and evidence
Evidence - information, facts, or data supporting a claim
Conclusion - a final claim based on reviewing the data and evidence
What is mass?
Mass is defined as the amount of matter in an object. Mass is typically measured in units of grams or kilograms. The mass of an object is constant and does not change based on the location of the object. An object that has a mass of 10-kilograms on Earth would have the same mass on the moon, but the object's weight would be about 1/6 its weight on Earth since the force of gravity on the moon is less than the force of gravity on Earth.
What is volume?
Volume is defined as the amount of space an object takes up. Volume has a wide variety of units of measure, including English measures of gallons, pints, and cubic feet; and metric measures of liter and cubic centimeters.
What is density?
Density can be thought of as the compactness of a material. The more compact the material, the higher the material's density. Density is defined as the mass of an object divided by its volume. Common units of density are grams per milliliter or grams per cubic centimeter.
Why do some objects sink and other objects float?
The sinking or floating of an object placed in a fluid depends entirely on the comparison of the density of the object versus the density of the fluid. A denser object will sink in a less dense fluid. A less dense object will float on a more dense fluid. If the object's and fluid's densities are identical, the object will hover in position at whatever depth the object is released in the fluid.
Reading and Interpreting a Line Graph
What is a Line Graph?
A line graph is a tool that provides a picture using a line or lines to show how things change over time or how they're connected. For instance, you want to see how a plant grows over time. So you measure the plant's height every week. You can use a line graph to see how the plant is growing!
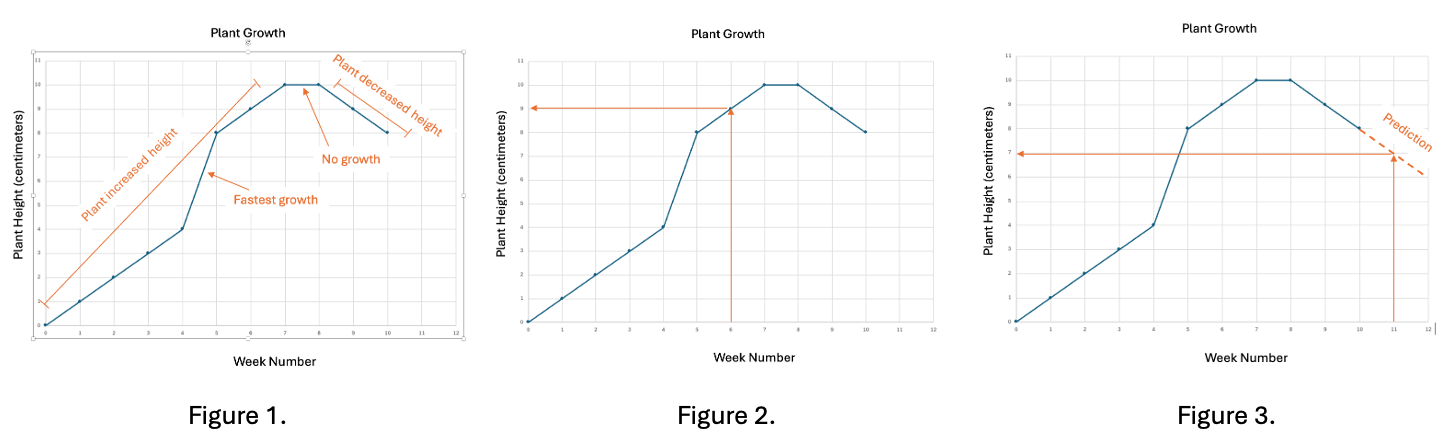
Reading and Interpreting the Graph (See Figure 1.)
• Seeing Changes: Look at the line. If it goes up, the plant is growing! If it stays flat, it's not changing its height, and if the line goes down, the plant is losing height.
• Comparing Weeks: You can easily see which weeks the plant grew the most by looking for the steepest parts of the line.
Finding the Height (See Figure 2.)
• To find the plant height at a certain week, find that Week Number on the bottom line (x-axis), go straight up to the line, and then look across to the Plant Height number on the side (y-axis). On this graph, the plant at week 6 had a height of 9 centimeters.
Extrapolating the Data Beyond the Line (See Figure 3.)
• Following the Trend: If the line is going up or down steadily, you can predict that the plant will continue changing its height at about the same rate in the next few weeks.
• Making a Prediction: You can extend the line a little bit past your last data point (see the dashed line) to make a prediction about the plant's height in the future. But remember, it's just a prediction! Things might change.
Using our extended line in this graph, we predict the plant will have a height of 7 centimeters at week 11.
• Limitations: Extrapolating too far out is not always accurate. The plant could stop growing, or grow at a different rate.
)
What information does the slope of a line provide?
The slope of a line provides information about how two variables are related. The slope is defined as the rise of the line (change in the "y" variable) over the run of the line (change in the "x" variable). A steep slope indicates that the "y" variable changes drastically, while the "x" variable changes much less. A near flat slope shows that the "y" variable changes little, while the "x" variable changes greatly.
How can a line graph be used to predict unknown values?
Graphs provide a way to quickly analyze the relationship between variables. Graphs are typically constructed using two axes, the "y" axis where the dependent variable is plotted and the "x" axis where the independent is plotted. A line graph is constructed by plotting each "x" and "y" value, then connecting each point with a line. Best fit lines are constructed by drawing the "average" line through the points without connecting each point. Values of x and y that were not collected in the data set can be estimated by choosing any point on the line and drawing a horizontal line to the "y" axis to determine the y value and dropping a vertical line from the point to the "x" axis to predict the x value.
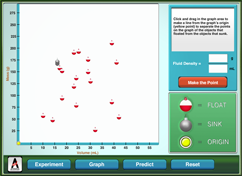 Fluids have a number of characteristics that can be used for identification, such as boiling point, freezing point, and viscosity. One of the most common properties used to identify a fluid is density. Can simply dropping various items in a fluid and some basic understanding of graphing be used to determine the fluid’s density? Don’t drop the ball, try out the simulation.