Here are some definitions to help you in your investigation.
Breathe - (fish) to take in water with dissolved oxygen and move the water out through their gills
Celsius (°C) - a unit of measure of temperature
Concentration - the amount of something dissolved in a solution
Dependent variable - a variable that changes because of the independent variable
Dissolved - becomes part of a liquid system to make a solution
Graph - a way to visually show two or more variables’ data
Independent variable - a variable controlled by the experimenter
Oxygen - a colorless gas that is critical for all living things
ppm - a unit of measure of concentration
respiration - Respiration is the process by which living organisms convert food into usable energy with the help of oxygen
respiration rate - Respiration rate is how many breaths a living thing takes in a certain amount of time, like counting how many times your chest moves up and down in a minute.
Solution - a mixture of two or more things with one thing evenly spread out in the other thing
Temperature - a measure of the hotness or coldness of something
Variable - something that can change
Reading and Interpreting a Line Graph
What is a Line Graph?
A line graph is a tool that provides a picture using a line or lines to show how things change over time or how they're connected. For instance, you want to see how a plant grows over time. So you measure the plant's height every week. You can use a line graph to see how the plant is growing!
Reading and Interpreting the Graph (See Figure 1.)
• Seeing Changes: Look at the line. If it goes up, the plant is growing! If it stays flat, it's not changing its height, and if the line goes down, the plant is losing height.
• Comparing Weeks: You can easily see which weeks the plant grew the most by looking for the steepest parts of the line.
Finding the Height (See Figure 2.)
• To find the plant height at a certain week, find that Week Number on the bottom line (x-axis), go straight up to the line, and then look across to the Plant Height number on the side (y-axis). On this graph, the plant at week 6 had a height of 9 centimeters.
Extrapolating the Data Beyond the Line (See Figure 3.)
• Following the Trend: If the line is going up or down steadily, you can predict that the plant will continue changing its height at about the same rate in the next few weeks.
• Making a Prediction: You can extend the line a little bit past your last data point (see the dashed line) to make a prediction about the plant's height in the future. But remember, it's just a prediction! Things might change.
Using our extended line in this graph, we predict the plant will have a height of 7 centimeters at week 11.
• Limitations: Extrapolating too far out is not always accurate. The plant could stop growing, or grow at a different rate.
)
What is temperature?
Temperature is a measure of the average kinetic energy of the particles in a substance. In other words, temperature is the hotness or coldness of a substance. Temperature is measured in units of Celsius, Fahrenheit, or Kelvin.
What is the dissolved oxygen concentration?
The concentration of dissolved oxygen (DO) is a measure of the amount of gaseous oxygen that is found in a liquid, such as water. Air typically has an oxygen concentration of about 210 cm3/liter, while a fresh water pond has an average DO concentration of about 8 cm3/liter. This means water only has about 3% of the oxygen contained in the same volume of air.
What does "ppm" represent?
The letters "ppm" stand for parts per million, which is a term used to describe the concentration of solute dissolved in a solvent. One ppm would equal a concentration of 0.0001%, which is a very dilute concentration.
What is respiration rate?
The respiration rate refers to the number of breathes an organism takes per minute. Generally speaking, the larger the organism, the slower the organism's respiration rate. For instance, an adult human typically takes about 16 breaths per minute, while a small field mice might breathe 160 times every minute. A number of internal and external factors affect the respiration rate of an organism. A person running requires more oxygen, and therefore, usually has a higher rate of respiration than when the person is standing still. A person in a low oxygen environment would have to breathe at a faster rate to intake the oxygen required to maintain life.
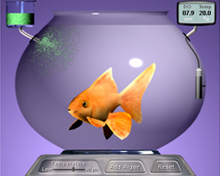
How does a goldfish breathe?
Although a few fish surface to breathe oxygen from air, most fish extract dissolved oxygen directly from water through their gills. A goldfish has a pair of gills that are located behind its head on both sides of the body. The mouth working in unison with the gills, moves water from the mouth over the gills to remove oxygen from the water. The respiration rate of a goldfish can be measured by counting the number of times each minute the gills and their coverings move.
What is algal bloom?
Imagine a pond with some fish and plants living peacefully. To help the plants grow bigger and faster, someone adds fertilizer to the water. Fertilizer is like vitamins for plants! But what happens if they add too much fertilizer? It's like giving the plants way too many vitamins! The plants can't use all of it, and the extra fertilizer washes into the pond.
This extra fertilizer is like a feast for tiny water plants called algae. They start growing and multiplying super quickly, covering the pond's surface in a thick green layer called an algal bloom.
Algal blooms are bad news for the pond. They block sunlight, so the plants underwater can't grow. When the algae die, they rot and use up all the oxygen in the water. This makes it hard for fish and other animals to breathe, and they might even die. So, while a little fertilizer can be good, too much can harm the pond and all the creatures living in it. It's important to use fertilizer carefully to keep our ponds healthy and happy!
What is a direct relationship?
In a direct relationship, as one variable changes, the other variable changes in the same direction. For instance, if one variable increases, the other variable would also increase. If the variable decreases, the other variable also decreases.
What is an inverse relationship?
In an inverse relationship, as one variable changes, the other variable changes in the opposite direction. For instance, if one variable increases, the other variable would decrease. If the variable decreases, the other variable would increase.
 Goldfish were one of the first fish ever to be kept as a domestic pet and still today, remain as one of the favorite household pets. Some goldfish have reached an age of 40 years old. Do you know what factors affect how a goldfish breathes? Catch your breath and start this investigation of Goldie, the goldfish.