How has the analysis of urine evolved over time?
The analysis of urine to detect physiological problems is as old as medicine itself. Historical accounts of urinalysis include Roman and Greek physicians observing ants gathering at the location of urine on the ground from a person, most likely with diabetes mellitus, where they were attracted to the glucose in that urine. Researchers such as Henry Bence-Jones in 1847 developed a chemical method to detect small molecular-weight, antibody light chains in urine using an acidic solution, and correlated their presence with an instance of multiple myeloma. Stanley Benedict, in 1909, demonstrated that copper sulfate solutions with a blue color would change to shades of green and red in proportion to the amount of reducing substances, like glucose, in the urine, as Cu+2 was converted to Cu+1 as the sample was heated. This "Benedict’s" test was one of the first to be made into an easy-to-perform method where the copper reagent was in tablet form to which the urine would be added. Even easier and more patient-friendly was a glucose oxidase/peroxidase method impregnated onto a paper strip (TesTape®) available in the 1950s, yielding a visual color change result which was directly proportional to the concentration of glucose. Such colorimetric tests on a random urine sample were developed into a multi-test reagent strip by the Ames Company in 1957.
What are the principles of colorimetric reagent strip tests for random urine?
While single test reagent strips are available, the majority of random urine testing performed clinically involves an inert plastic strip onto which are placed multiple pads, each impregnated with reagents to allow a colorimetric reaction whose intensity can be related qualitatively or semi-quantitatively to a specific analyte concentration.- Specific gravity: Ionic species in the urine cause the dissociation of an electrolyte on the pad, which causes a color change of a dye.
- Glucose: Glucose oxidase and peroxidase catalyze a two-step reaction leading to oxidation of a dye.
- Protein: Selective for albumin, a dye maintained at pH 3 will change color in proportion to the amount of albumin present.
- Ketones: Nitroprusside reacts with acetoacetic acid and acetone to produce a purple color.
- Hemoglobin: This shares the same peroxidase reaction as the second step on the glucose pad, with the difference being the heme of hemoglobin "pseudocatalyzes" the oxidation of the dye on the pad.
- Bilirubin: A diazo reaction causes a color change on the pad.
- Urobilinogen: A different diazo reagent than used in the bilirubin reaction causes a color change on the pad.
- Nitrite: The only qualitative reaction on a multitest reagent strip uses reactions to yield a pink color that indicates the presence of at least 105 bacterial organisms per milliliter.
- Leukocytes: The leukocyte esterase in granulocytes reacts with an ester substrate followed by a diazo reaction.
- pH: The pH indicators methyl red and bromothymol blue provide results from 5.0 to 8.5.
What is the difference between qualitative, quantitative and semi-quantitative results?
- Qualitative results cannot provide any idea of actual amounts of an analyte present in the sample. The reagent developers have adjusted the level of reagents in the pad to give one color when the analyte concentration is "normal/healthy" and another color when the concentration is not normal. The concentration which is that dividing line is called the sensitivity of the method. Qualitative results will be reported out as "positive/negative," and without any numerical value or concentration unit provided. On urinalysis reagent strips, only the nitrite test is qualitative.
- Quantitative results will always have a numerical value and, if appropriate, concentration units. Such results happen after an instrument signal is compared to that of a set of calibration standards. Such results will be able to determine small differences in concentration in concentration. No reagent strip results are usually determined this way.
- Semi-quantitative results will never be able to determine small differences in concentration, but can do more than indicate "positive/negative." All of the reagent strip results except for nitrite are reported out semi-quantitatively. You can tell this because there are large jumps in concentration between what is called "trace," "small," "moderate," and "large," or "+1," "+2," "+3," and "+4" in such tests. The result provides a general idea of the level of concentration of the analyte without giving an exact level. For example, if a sample has 47 mg/dL of albumin, the color development will be between that which the instrument recognizes as "30 mg/dL" and "100 mg/dL." Since the color is closer to the lower value, that is the one which will be reported.
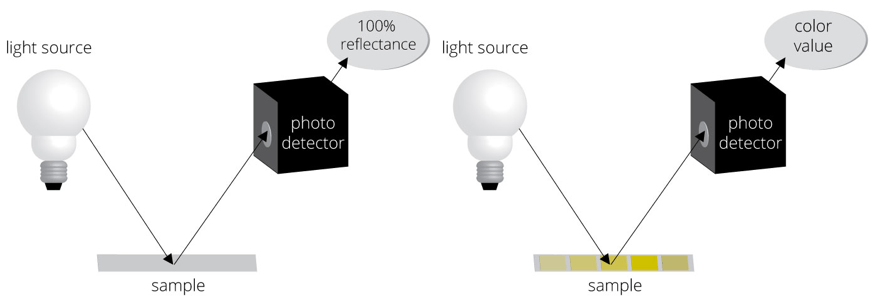
How do automated urinalysis readers measure reagent strip colorimetric reactions?
One of the greatest advantages of automated urinalysis is the removal of bias due to the different abilities of individuals to perceive color. The principle of the method used to read each pad’s color is reflectance colorimetry. A wavelength of light is first directed toward a white calibration area on the strip platform (figure on left), establishing what is 100% reflectance. The light is then directed toward a pad on the strip (figure on right), and the intensity of the color developed on each pad will affect the amount of light reflected off of the pad toward a photodetector. Comparison of that amount of reflected light to that reflectance stored in memory (this reflectance = this concentration of the analyte) will determine the concentration displayed for that analyte for that sample. This process continues for each pad on the strip. Reference ranges established by the lab professionals and stored in the instrument’s memory will be used to indicate on the final report which concentrations are "out of range."
)
How do automated readers perform the microscopic part of routine urinalysis?
A portion of the aspirated sample is added to a "sheathing fluid," which makes the formed elements travel single-file in a small (and measured) volume in the tubing to a flow cytometer within the instrument. As each formed element passes by the visualizing area, a strobe light flashes rapidly and the digital camera captures hundreds of frames per sample.
Each isolated formed element is analyzed for size, contrast, shape and texture. Algorithms in memory are used to classify the formed elements into categories including red blood cells, white blood cells, bacteria, casts, yeast, sperm, mucus, epithelial cells, amorphous masses, and crystals. Another algorithm will be used to estimate the concentration of each formed element. If a formed element does not meet the identification algorithm criteria for any of these, it will be called "unclassified," requiring the laboratory professional’s evaluation. Note that most automated urinalysis instrumentation cannot identify Trichomonas and may classify a formed element incorrectly.
The images of formed elements from a sample will be visualized by category in a collage on the monitor so the laboratory professional can confirm all the classifications are correct. An opportunity to reclassify an incorrectly evaluated formed element is an important function of the lab professional. The greatest amount of time is usually spent looking and categorizing the unclassified elements into either a classical type or as artifact. A laboratory professional’s manual microscopy expertise is very critical for confirming all the instrumentation’s classifications.
How do automated readers perform the color, clarity, and specific gravity parts of routine urinalysis?
Prior to the sample being placed onto the strip or traveling for microscopic analysis, a portion may be sent to a module to perform specific gravity measurement by a refractometer. The module also has a flowcell that completes color analysis using white light and assesses the clarity of the sample via light scattering.
How is the correlation of physical, chemical, and microscopic analyses done in automated readers?
All automated urinalysis systems will display physical and chemical results at the same time as the microscopic collages. This way, it can be easy for the lab professional to note, for example, when a "large" blood chemical reaction on the strips conflicts with no intact red blood cells microscopically. This, plus a reddish color and low specific gravity, could suggest that the red blood cells may have become lysed due to the low specific gravity. If the SG is high, it could suggest the color and blood reaction may actually not be from red blood cells but rather from myoglobin. A positive nitrite reaction would correlate with a large number of bacteria in the sample, and these would correlate with a high pH and large number of leukocytes to suggest a urinary tract infection. At present, none of the available automated urinalysis instruments have algorithms in memory to do such correlations. It remains the skill of the laboratory professional to do that role, particularly in identifying and following up potential false positive or negative results.
 Urine as a biological fluid has significant advantages and disadvantages over blood as a preferred specimen for the detection of biomarkers that can point to health and disease. Urine testing in a clinical laboratory setting can range from the simplest visual observations to fully automated analysis. Your challenge includes discovering the correlations between manual and automated urinalysis, identifying test results that are qualitative or semi-quantitative, identifying the components of automated urinalysis instrumentation, and gaining skills in identifying microscopic formed elements without a microscope.
) Each isolated formed element is analyzed for size, contrast, shape and texture. Algorithms in memory are used to classify the formed elements into categories including red blood cells, white blood cells, bacteria, casts, yeast, sperm, mucus, epithelial cells, amorphous masses, and crystals. Another algorithm will be used to estimate the concentration of each formed element. If a formed element does not meet the identification algorithm criteria for any of these, it will be called "unclassified," requiring the laboratory professional’s evaluation. Note that most automated urinalysis instrumentation cannot identify Trichomonas and may classify a formed element incorrectly. The images of formed elements from a sample will be visualized by category in a collage on the monitor so the laboratory professional can confirm all the classifications are correct. An opportunity to reclassify an incorrectly evaluated formed element is an important function of the lab professional. The greatest amount of time is usually spent looking and categorizing the unclassified elements into either a classical type or as artifact. A laboratory professional’s manual microscopy expertise is very critical for confirming all the instrumentation’s classifications.
Each isolated formed element is analyzed for size, contrast, shape and texture. Algorithms in memory are used to classify the formed elements into categories including red blood cells, white blood cells, bacteria, casts, yeast, sperm, mucus, epithelial cells, amorphous masses, and crystals. Another algorithm will be used to estimate the concentration of each formed element. If a formed element does not meet the identification algorithm criteria for any of these, it will be called "unclassified," requiring the laboratory professional’s evaluation. Note that most automated urinalysis instrumentation cannot identify Trichomonas and may classify a formed element incorrectly. The images of formed elements from a sample will be visualized by category in a collage on the monitor so the laboratory professional can confirm all the classifications are correct. An opportunity to reclassify an incorrectly evaluated formed element is an important function of the lab professional. The greatest amount of time is usually spent looking and categorizing the unclassified elements into either a classical type or as artifact. A laboratory professional’s manual microscopy expertise is very critical for confirming all the instrumentation’s classifications.