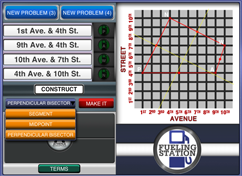
What is a line segment?
A line segment is a part of a line that has an endpoint on each end. Unlike a line or a ray, a line segment has a distinct length.
What is the slope of a line?
The slope of a line is the rate at which it goes up or down. If a line moves up from left to right, it has a positive slope. The faster it goes up, the higher the slope. If a line moves down from left to right, it has a negative slope. The faster it goes down, the more negative the slope.
What is a midpoint?
A midpoint is the point on a line segment that is equidistant (the same distance away) from both endpoints.
What is a perpendicular bisector?
A perpendicular bisector is a line that goes through the midpoint of a segment and is also perpendicular to the segment. Because it intersects the line segment at its midpoint, it splits the line segment in half.
What is a Voronoi diagram?
In a Voronoi diagram, an area is drawn around each point such that everywhere inside the area is closer to that point than any other point. A simple example of this is a basketball player playing zone defense. The basketball player is the point, and the zone that he or she guards is the area. If the ball is in the player's zone, it is closer to that player than any other defensive player.
How are Voronoi diagrams used in business settings?
Voronoi diagrams are often used by restaurant owners to decide where to open a new restaurant so that it will take business away from their other restaurants equally. Voronoi diagrams are also used by cell phone companies to determine where to install new cell phone towers so that the new tower is installed in the optimal location.
Here are some definitions to help you in your Grade 3-5 Lesson 1 investigation.
Graph - an organized “picture” representation of data
Data - facts, numbers, or items of information
Point - a pair of numbers used to locate a position on a graph
Axis - a pair of perpendicular lines used to locate points on a graph
Perpendicular - two lines that meet at right angles to each other
Scale - a set of equally spaced marks at fixed distances on an axis
Plot - to place a point at a given location on a graph
Icon - a symbol that represents something
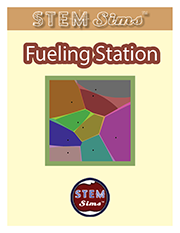
 Long lines have greeted people wishing to fill their vehicles with natural gas at the three local fueling stations. The company owning the stations wants to add a fourth station to satisfy the increasing customer demand. However, the company doesn’t want to hurt the business of one of their stations more than the other stations. Your challenge is to determine where the new fueling station should be located so that all three existing stations equally share in the loss of business from the new station. Get fueled up and start your investigation.